
Learn how to manage risks by using machine learning in a data visualization tool such as Qlik, Tableau, and Power to control customer churn.
Customer retention is important to most businesses because of the direct loss of revenue associated with lost customers. There are other costs too: acquiring a new customer is usually more expensive than retaining a customer, and your company reputation is on the line if severed ties result in bad press and negative reviews.
In this blog, I show you how to mitigate these risks by using machine learning in a data visualization tool such as Qlik, Tableau, and Power to predict and control customer churn.
Advanced Analytics Help Us Make Proactive Decisions
While traditional analytics tools help us see who left and the associated revenue loss (both important metrics), we are stuck looking backwards and guessing how to reduce customer churn. When we introduce advanced analytics to the data, we look forward to answer questions like “who is at risk of churning?”, “how will that impact budgets?”, and ultimately, “what can I do about customer churn before it happens?”

Example Scenario: Customer Churn for a Telecommunications Company
Customer churn is a unique challenge for B2C telcos because the target market is massive, consumers have several alternatives to choose from, and there is little variance in competitive offerings. In the following demo, I used a combination of traditional and advanced analytics to analyze a set of example telco data to understand customer attrition for that company and how they could control the churn.
Note: the following screenshots are pulled from a model in Qlik, but the same findings could be accomplished in other data visualization tools in the market. The focus here is not the technology, but rather that you can apply advanced analytics in the tools you are comfortable using to answer very important business questions.
The image below is an executive level dashboard presenting customer churn KPIs. The waterfall chart on the left shows dollars associated with current or lost customers, and on the right we see customer counts.

The dashboard quickly provides a grim story: more customers left our clientele than entered –in raw counts and represented in dollars. We also see that the value of those leaving is higher than new customers. So, not only is churn a problem, but so is the makeup of customers that are leaving and entering the customer base.
At this point, an analyst may dig deeper and slice the data by various attributes and dimensions to understand what is causing these problems. Here’s a drill-down dashboard showing more detail.
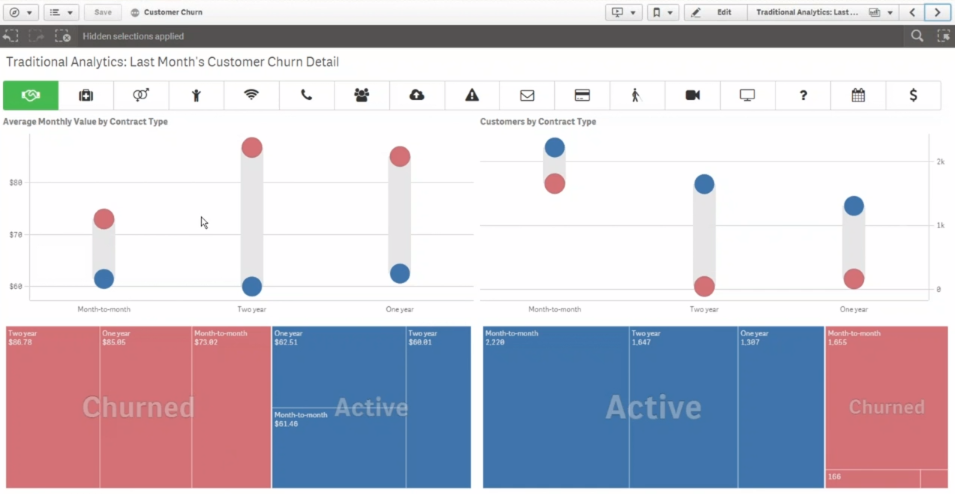 Distribution plots allow us to see a “spread”. The bigger the spread, the less churn, and vice versa – the smaller the spread, the more churn there is (indicative of something problematic).
I see some representations here: there is low churn among customers with 2-year contracts, and high churn among month-to-month contracts. However, I also see that the month-to-month category represents the highest count and value among customers represented on the graph. Given this information, I cannot discount month-to-month contracts; I need to dig deeper to understand the overall profile of those customers who leave.
This dashboard shows customers broken down by the type of internet service they use.

This shows that DSL customers are pretty loyal, but fiber-optic customers are more likely to churn. Again, we cannot look at this data in a vacuum – this doesn’t mean that fiber optic customers are invaluable because there are many other attributes at play among telecommunications customers.
This dashboard shows customers broken down by their payment type.

Traditional Analytics: Payment Type Breakdown
Those on auto-pay and who mail checks are loyal, but customers who pay via electronic check are much more likely to churn. But, I know better than to attribute the churn problem to those paying by electronic check.
At this point, the dilemma is clear:
Despite all the important data points we get from our data visualization tools, we still don’t understand how the customer attributes work in concert to influence churn. Even the most sophisticated data visualization tools cannot present the data in a way for us to comprehend this, because the human brain cannot analyze multiple dimensions at the same time. Though we have unearthed some interesting information, we still have not satisfied the goal of isolating why customers churn.
Introducing Machine Learning to the Data
If our brains can’t compute at the level needed to get ahead of customer churn, machine learning can help. Building an effective machine learning model takes expertise, but it isn’t magical – it is simply seeking patterns in the data provided. What is critically important when building a model is clarity on what exactly you want to predict and knowing if you have the data, processes, and infrastructure to get there. You might be able to tackle some questions immediately, and some may take more preparation to answer.
Once you have a reliable model, skip the learning curve. The model can be integrated into your existing reporting platform so that business users can use additional attributes to make better decisions in a tool they already know.
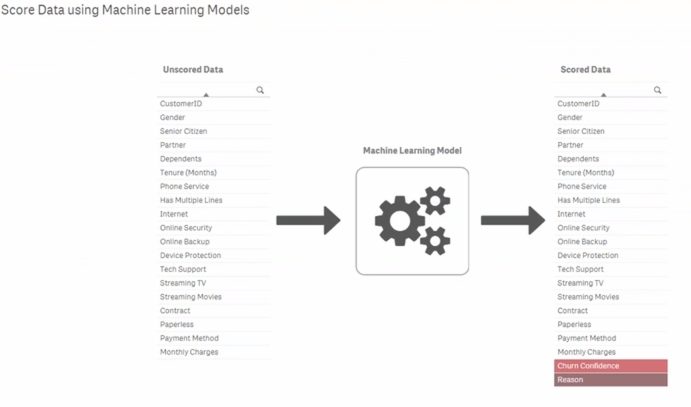
Add an Attribute: Churn Confidence Level
For this demo, I told my model that we want to see a Churn Confidence level for each customer. We defined this Churn Confidence number as somewhere between 0 and 1; the closer to 1, the more likely the model predicts the customer will leave.
With this new data point in our tool, I can build new visualizations that help us predict churn with some level of confidence and start what-if analysis. We can set the churn confidence thresholds higher and lower (depending on how optimistic we are feeling) to see how churn predictions affect numbers like overall customer counts and revenue.

What is the Profile of our Loyal vs Churning Customers?
Along with the Churn Confidence number, the model I applied to the data provides us with granular detail about customer attributes.

This is incredibly rich data, but it’s impossible to eyeball any patterns. The table shows the most loyal customers, but we can’t identify why. So, rather than having the machine learning model produce granular level detail and do line-by-line customer scoring, I can ask it to identify patterns and create customer profile groupings for us.
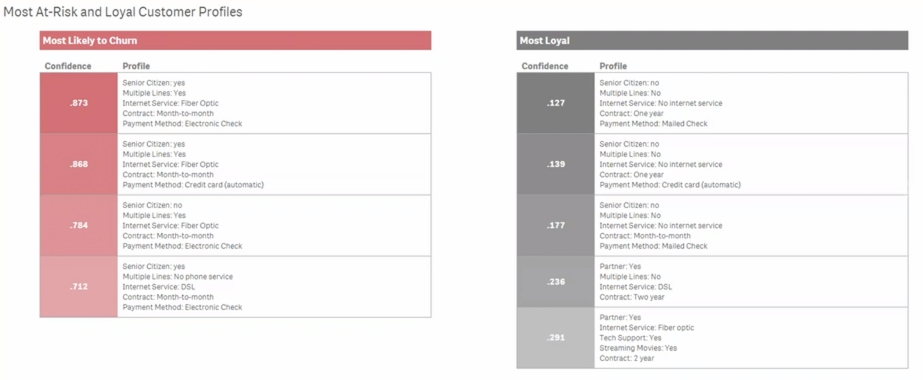
Now, I have clear profiles of Most Likely to Churn and Most Loyal customers. With the data organized in this manner, the business can start to take action. Product Management has a better sense of relevant product features, Marketing can do more targeted marketing, Sales knows which customers need more nurturing, and leadership has a better grasp on what impacts their bottom line.
More Questions to Ask of the Data
In this example, I went down one path of questions– what’s the profile of a loyal customer versus one likely to churn. But there are infinite questions we can explore with machine learning. With customer profile information at hand, this begs the next question: who is mostly likely to respond to our marketing campaigns and via what channels? Other examples of questions we can ask of the data could include:
What are my loyal customers doing with phone-only service?
How do I define a “high-value” customer? It may not be the customer paying more this month; it could be the customers paying most over time. What is the balance between loyalty + margin + TLV
What kind of month-to-month customers do we want?
What are the warning signs of a customer becoming at-risk?
What should Customer Salvage reps offer to customers trying to leave?
Which customers need proactive attention?
What behavioral changes have the least friction?
How sensitive are our customers to price?
All these questions could be explored via traditional dashboards, and you may even be able to uncover some answers after several hour/days/weeks of grueling examination; but machine learning is required to get answers in a reasonable amount of time. And as your machine learning models mature, so should your datasets. It’s important to continue to augment your data to answer more questions and get ahead of issues such as customer churn before they negatively impact your business.
Comments are closed, but trackbacks and pingbacks are open.